


Taking Custom Fields to the Next Level with BI Dashboards
In previous Pro-Tips, I discussed the importance of custom fields in Lansweeper and how they provide the foundation for effective asset classification, as well as explored a method to automate/populate the fields from a local CSV. By categorizing your assets based on custom criteria—like environments, applications, or monitoring status—you can ensure your IT inventory is organized in a way that works for you, your team, and your entire organization.
With Lansweeper’s new BI Dashboards currently in Beta (Sign up at https://www.lansweeper.com/product/beta if you don’t have the feature), you have the flexibility to move past the traditional dashboards that you see everywhere – and put those custom fields into action to really create something special.
In this walkthrough, I’ll show you how to create a quick and easy custom dashboard using the BI Dashboards feature, integrating a few of the custom fields that I have written about along the way. Remember: it’s not just about categorizing assets — it’s also about using classification to achieve better IT Asset Management (ITAM), more efficient IT Service Management (ITSM), Smoother IT Operations Management (ITOM), and a stronger posture for Information Security (InfoSec)… and, most importantly for being a proper SysAdmin, seeming more intelligent by your peers by saying all of those acronyms out loud and pretending that making these custom dashboards is really difficult.
The Custom Fields
The custom fields in this demonstration are: Environment (Production, Development, QA, etc.), Application (Lansweeper Database, Veeam Backup and Replication Manager, etc.), Application Family (Lansweeper, Veeam, etc.), Monitored by PRTG (yes/no), Backed up by Veeam (yes/no) – but this walkthrough works for any custom fields you prefer to use.
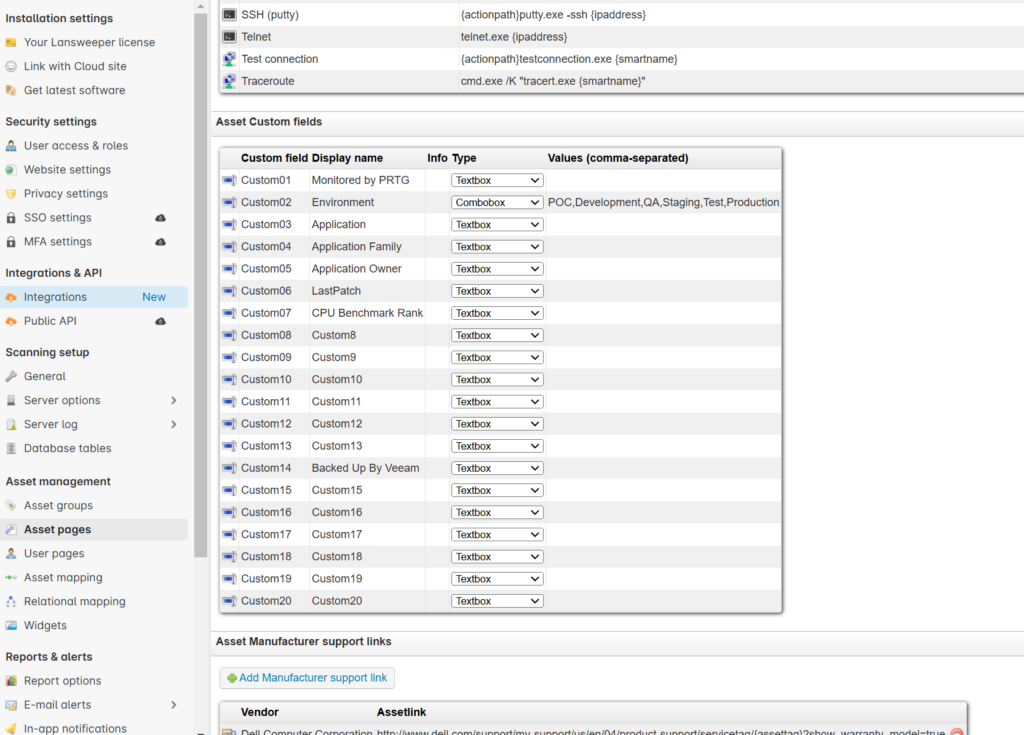

To begin, you need to enable Lansweeper’s BI Dashboards. This updated feature offers advanced visualization options to help you analyze your asset data.
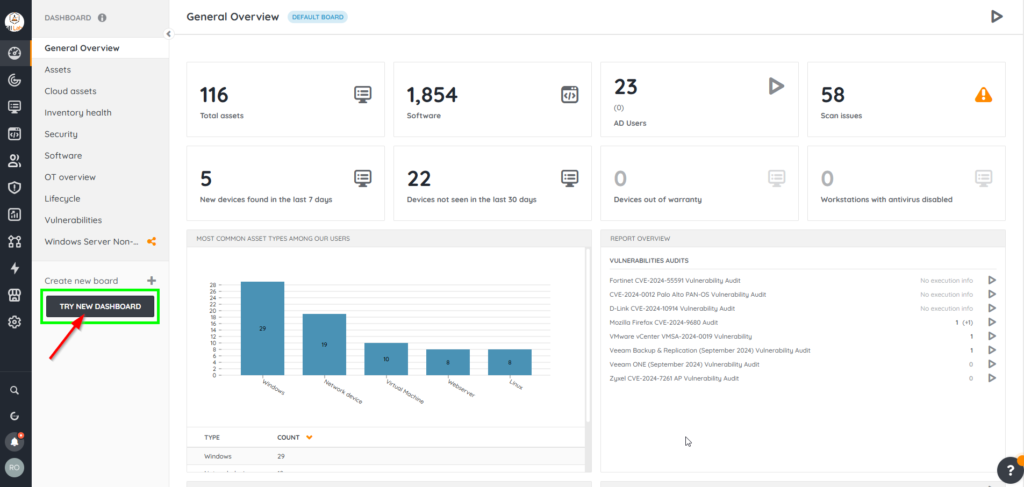
Once you’ve entered the new dashboard interface, the first thing you’ll do is create a blank dashboard to start customizing.
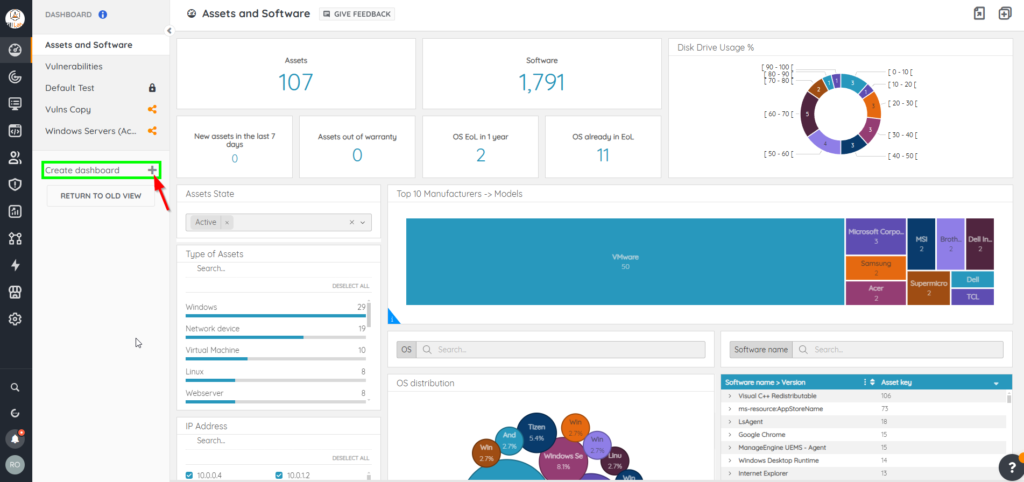

The Asset Count widget provides a quick summary of the total number of assets matching your criteria. Here’s how to set it up:
Add the Widget:

Configure the Data Source:
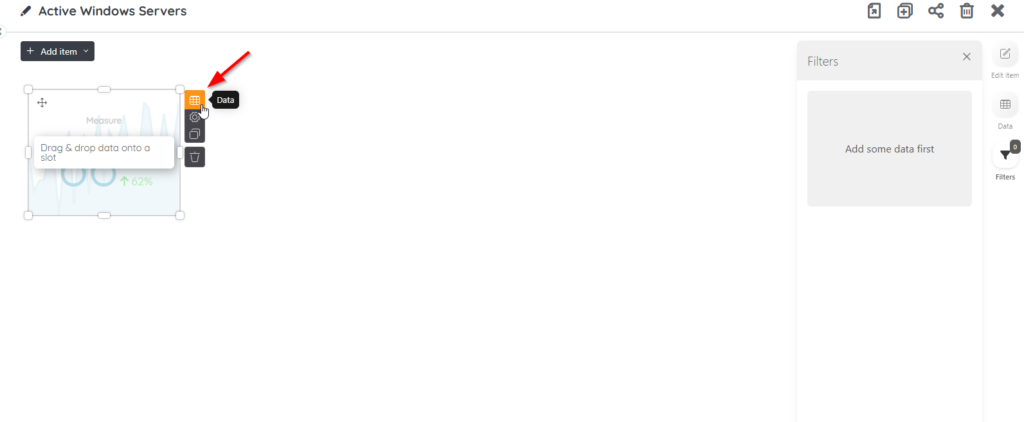
Open the Inventory dataset and locate the Asset Key field.

Drag the Asset Key field into the Measure slot to count the total number of assets. (Rename as appropriate – example ‘Asset Count’)

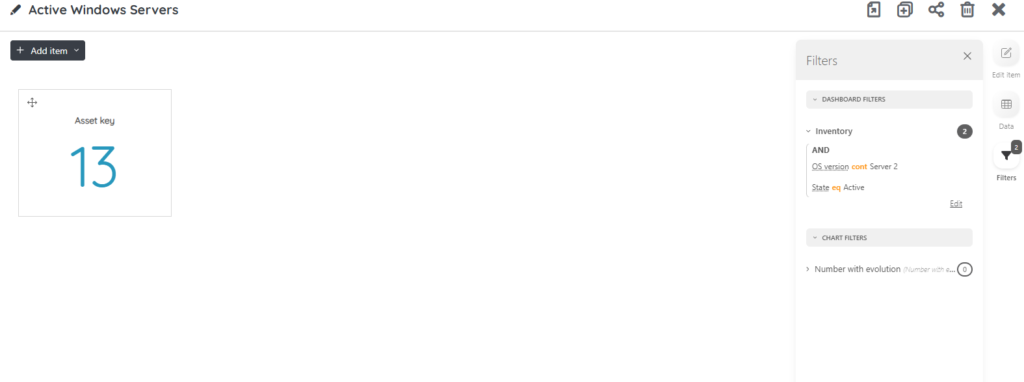
For this step, we want to put a filter on the overall dashboard to limit any data to Active Windows Servers:
Equals Active.Starts With 'Windows 2'.


The widget should now display the total count of active assets. For example, if there are 13 active servers, the widget will display “13.”
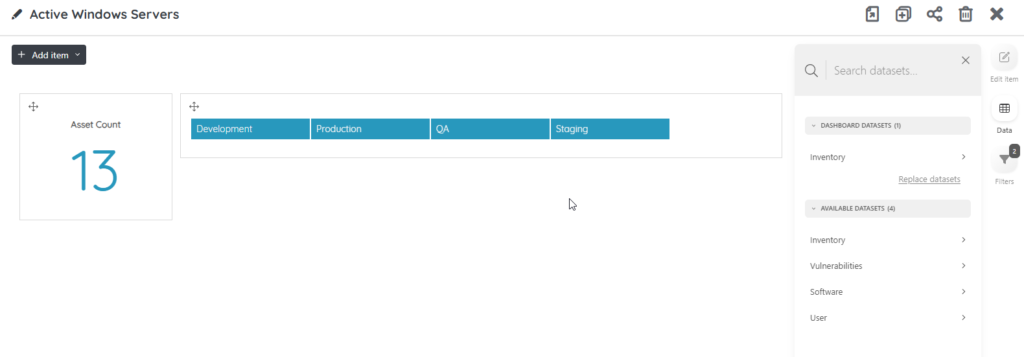
Slicers allow you to dynamically filter your data based on custom fields like environments.
Add the Slicer:

Configure the Data Source:

Verify the Slicer:
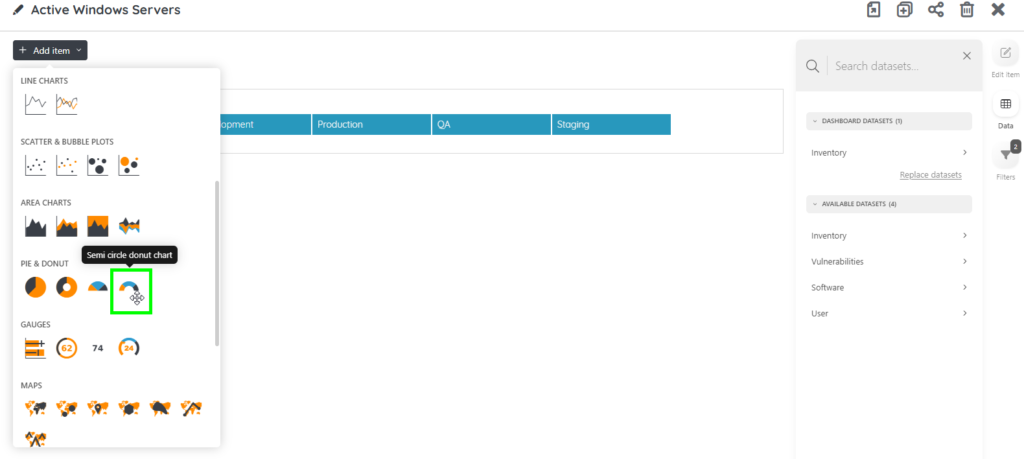
A semi-circle donut chart provides a visual breakdown of application families.
Add the Chart:
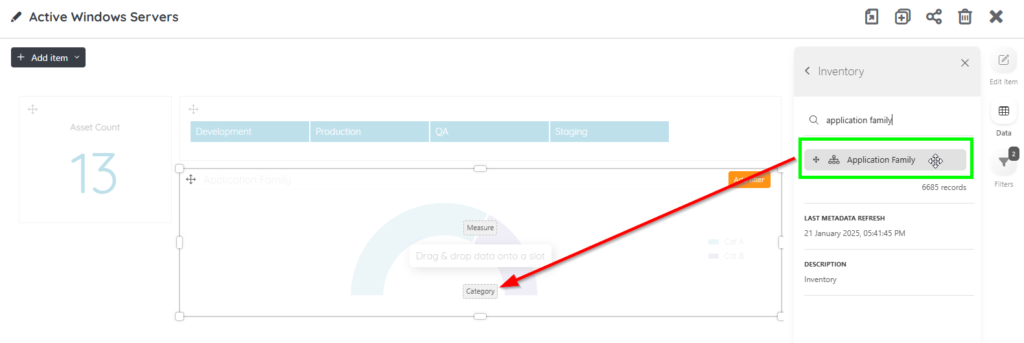
Configure the Data Source:

Enable Cross-Filtering:

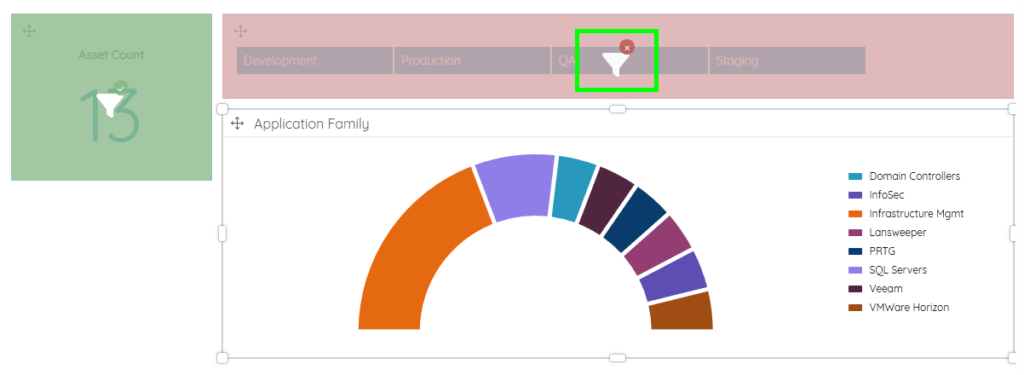
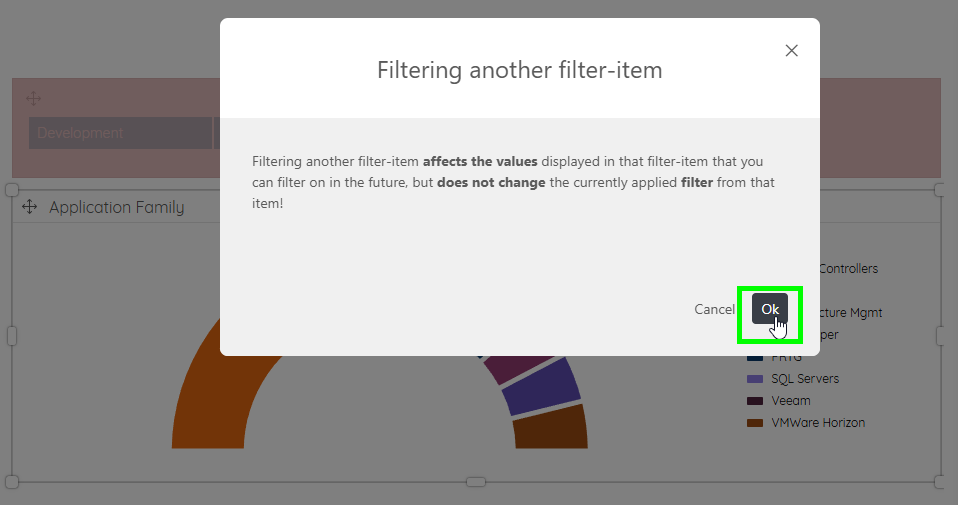
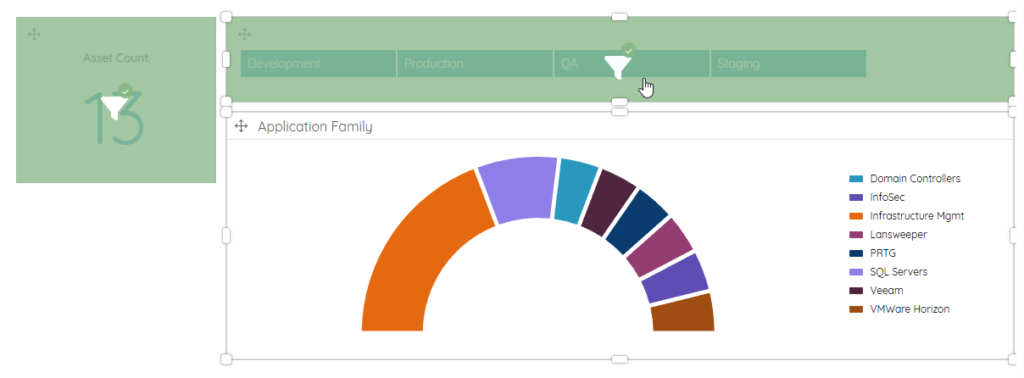
Edit the Chart Settings to suit your needs (Title, Legend, Labels, Values, etc.)
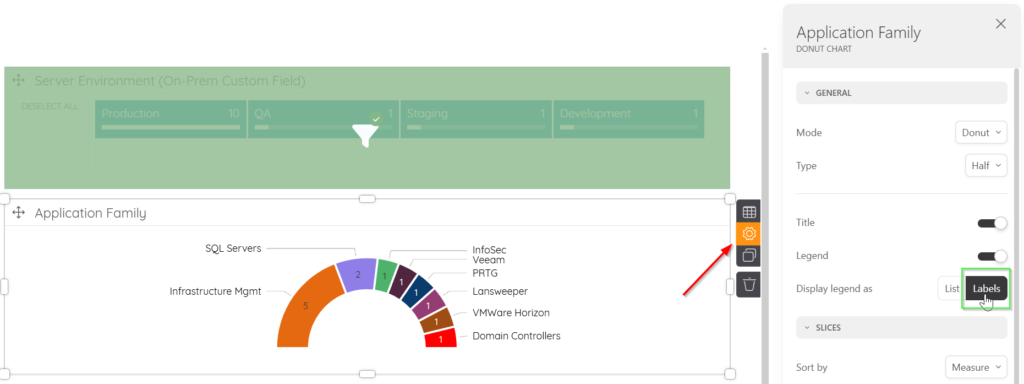
Add Other Widgets/Items to Complete the Dashboard
Now that you are familiar with the basics of placing charts and adding data, you can recreate the entire dashboard by using the following reference images (Tip: Just duplicate a widget for similar charts to speed things up even more)
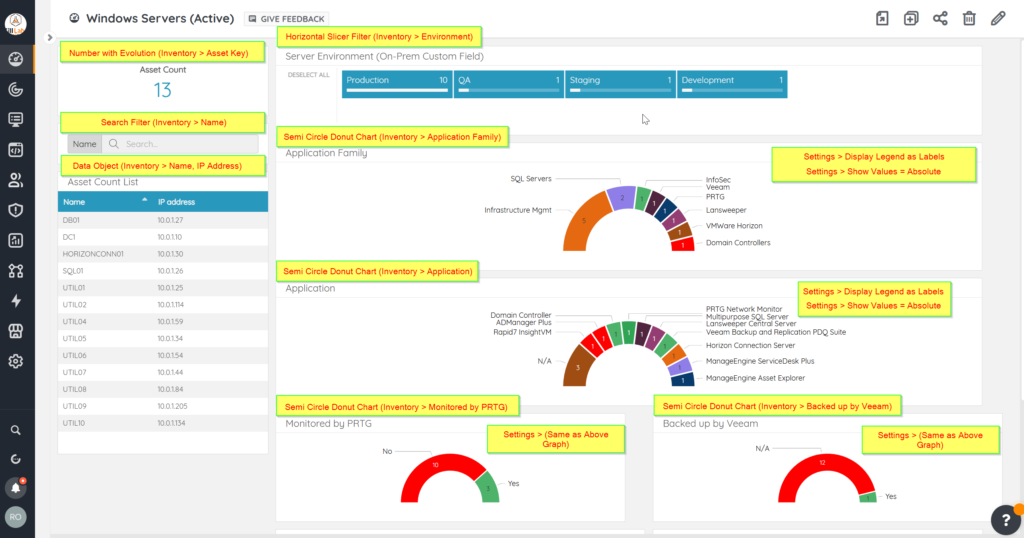
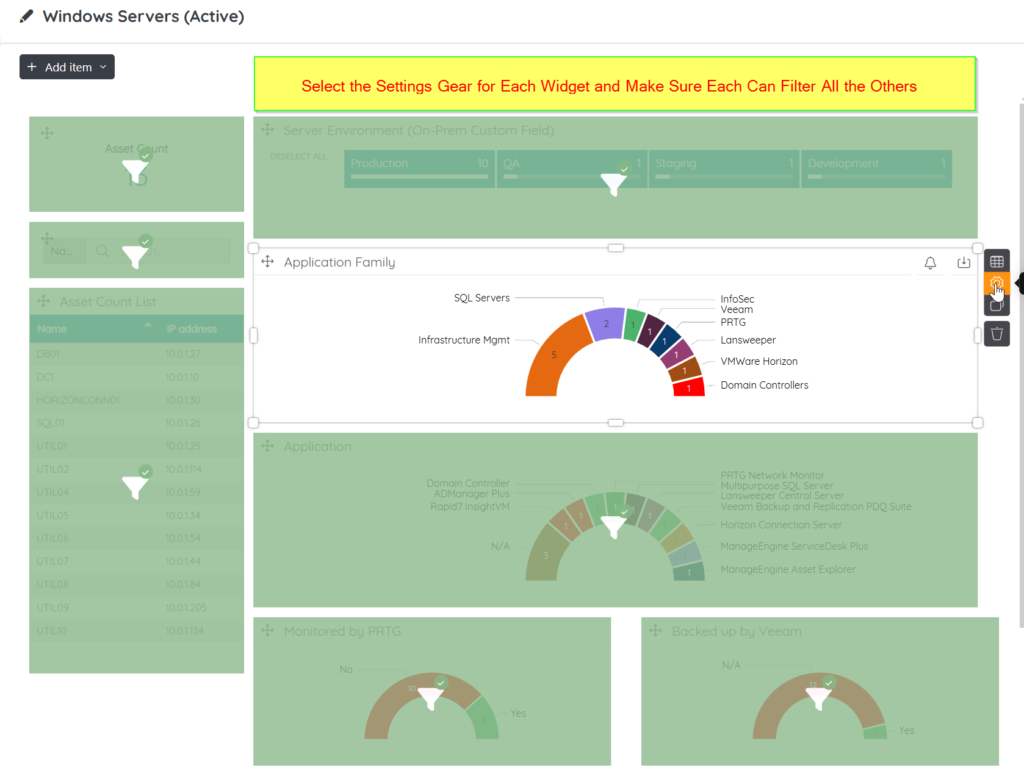
And there you have it – A dashboard that instantly shows how many servers you have, the environment and general purpose of them, and monitoring and backup compliance – all at a single glance. And, with the new BI-Dashboard beta, you can interactively click data points to see correlated data across the page – saving time with investigations, or gathering further details on various scenarios/combinations of asset data (with more features to come!)
There’s still much more that you can do with this strategy coupled with the power and flexibility of Lansweeper – and I’ll be sharing some more ideas, scripts and tips on this in future Pro-Tips.
Sweep On, Everybody!
-Jacob
Explore Lansweeper for free.
No credit card required.


