Pro Tips with Esben #26
This week we take a look at load balancing and some resources you can use to better manage your Lansweeper installation, scanning server and scanning targets spread.
As you probably know, Lansweeper lets you set up multiple scanning servers. Adding more scanning servers can be used to either scan more in a different location or to scan more in terms of volume. Additional scanning servers also allow you to do load balancing by spreading scanning targets over multiple servers. To help you manage your installations and scanning servers better, I’ve created a couple of resources that hopefully give you a better sense of how your installation’s load is balanced. All of the reports below can be used in a dashboard to create an installation status overview.
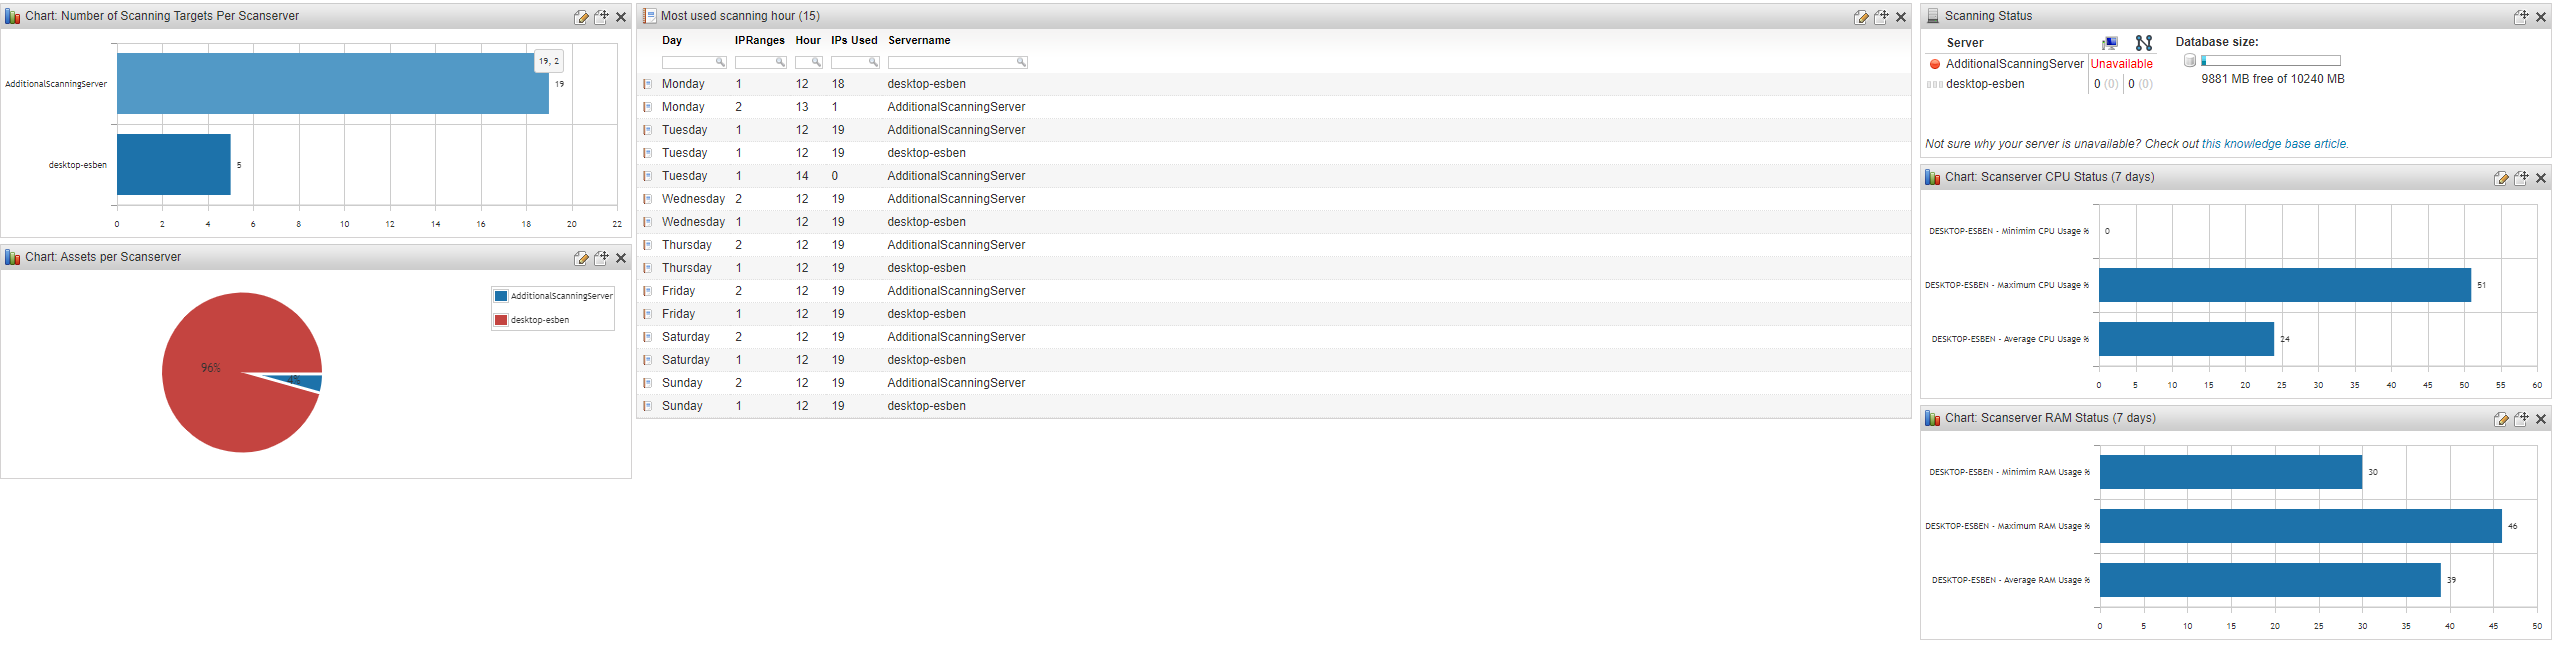
Scanning Targets Distribution
One of the ways to check if you’re load balancing is on point is checking exactly how many scanning targets you’re scanning with each scanning server.
Scanned Assets Distribution
Another way is by simply checking how many assets each scanning server is scanning. This will let you balance out the usage of your scanning server better, preventing that one scanning server is chugging away while the rest are dormant.
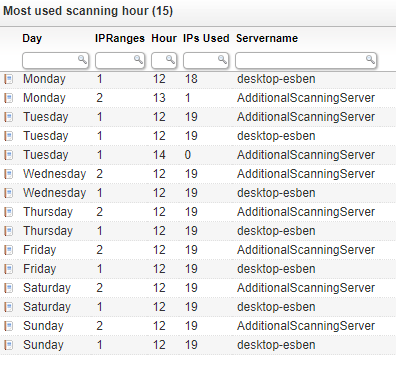
IP Range Scanning Hour Overview
Aside from knowing how many scanning targets you have on a scanning server, it’s also important to manage when assets are scanned. This will let you find out of you’ve got a lot of scanning targets triggering at the same time.
While scanning a lot at the same time isn’t necessarily a problem, as it will just create a longer scanning queue, it can become a problem if there isn’t enough time to work through the queue. This overview shows you how many IP Range scanning targets are being triggered on which day, at which hour, and how many assets are in the IP Range.
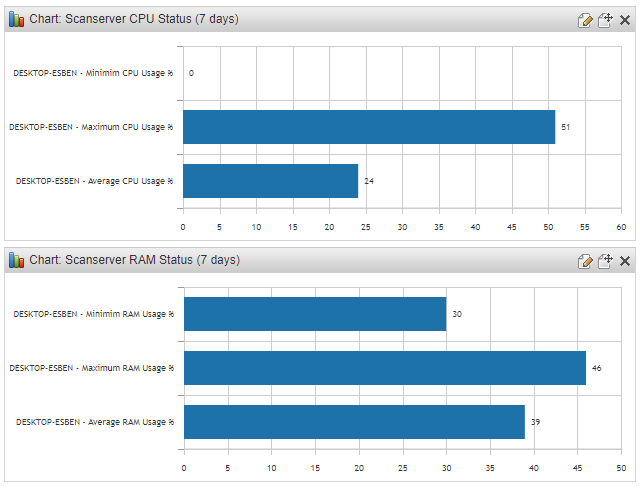
Scan Server Performance
While the default Scanning Status widget shows you the activity and the database size of your installation. There isn’t an easy view of the performance of your scanning servers. Lansweeper does scan performance data from scan servers by default, so the data should be available.
The two chart reports below show the minimum, maximum and average performance usage of your scan servers in the last 7 days.