IT analytics software refers to the tools IT departments use to manage, report on, and interpret the massive amounts of data they collect. Looking for patterns and insights in these large data sets, they can take steps to improve business processes, avoid common obstacles, and better support other business departments.
Why Do IT Analytics Matter?
Most modern IT Departments collect massive amounts of data to support a wide range of applications and to handle various IT scenarios ranging from infrastructure management to service desk applications, and cybersecurity. Each of those processes requires certain unique information to be gathered. At the end of the day, the IT Department finds itself sitting on a mountain of business data that is often going unused.
IT Analytics software allows teams to go to work with this data. By collecting everything in one centralized solution, you can report on and analyze the full data set to find relevant patterns and actionable insights. These can then be used to support projects, decision-making, and initiatives, improve performance and productivity, and spot and tackle recurrent issues. Creating order in the chaos means that teams can also provide real evidence to support business decisions to stakeholders and managers and meet IT KPIs.
Individual users can use the information gleaned from IT analytics to make better individual decisions and improve their own productivity. Having actual insights in hand instead of just raw data means that they can more efficiently resolve and avoid issues and optimize their processes.
Why Your Organization Needs Data Analysis in IT
In many organizations, the goldmine worth of data that IT collects in its daily operations goes unused. If it is touched at all then it is usually only used for the specific application or project it was collected for in the first place. However, that means that a wealth of business information is just sitting there, in all its untapped potential.
Centralizing IT Data
Having an IT analytics solution in place allows you to centralize data from all corners of your IT estate into one single source of truth. Your IT data is no longer a heap of raw data stored across multiple tools and platforms to sort through. Instead, an IT analytics tool pulls together all this information into ready-to-go insights, reports, and IT dashboards to support your operations.
IT Reporting and Dashboards
Once all your data is gathered in one place, you can get to work gathering the insights that are most valuable to your organization. Track projects and milestones by generating IT reports for both the team and your stakeholders and managers.
Having a tool in place to do the analytics for you means that you can focus on your day-to-day tasks, without having to worry about the mountains of data that need to be sorted through in order to turn it into something that can both support you and give you insight into the processes and results you’ve booked in the meantime.
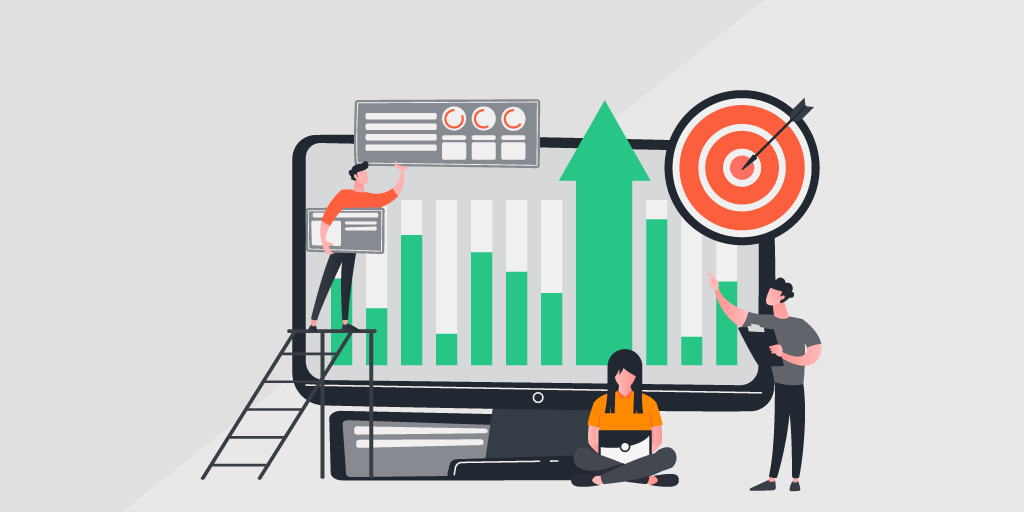
IT analytics software displays your information in the format that fits your needs best. This can simply be in reports that list the information you need, neat and orderly. But in many cases, you are looking for data visualization: charts and graphs that show you what you need to know at a glance. Visualization dashboards will give you those immediate insights usually in a customizable format.
Support Business processes
In the age of digitalization, IT is quickly becoming the backbone of any company. It is their task to keep all systems running smoothly so that other departments can keep working. The more IT is integrated with other departments, the more data is collected and the more people depend on that data being put to good use. Environments are becoming larger and are changing faster than ever before, lending more importance to the efficiency of your IT People.
Using the data centralized and organized in your solution, they can respond to incidents faster and more efficiently. Any request for information coming from other departments and stakeholders can be answered in seconds. Bringing together data from multiple applications and projects allows you to spot patterns and correlations and their impact on business processes. You can make business decisions with confidence knowing that you always have the latest and most complete data at your disposal.

Lansweeper for IT Analytics
Lansweeper provides you with a single source of truth for all your IT data. Its IT discovery capabilities are not use case specific. Rather Lansweeper specializes in gathering IT data from across your network to provide you with a complete database of all IT asset information that can be used to support any IT use case.
With over 400 built-in reports, you can easily filter out the information that is most relevant to you. If you cannot find what you need there, you can find more in our online report library, or you can simply build your own reports, by adapting existing ones or by starting from scratch.
As all data is already gathered in one place, you can now use it to keep other tools, like your CMDB complete and up to date, to take your IT tracking even further. Lansweeper offers a number of ready-made integrations with some of the leading CMDB tools on the market, as well as the possibility to create your own custom integrations
Once you have found the insights you are looking for, display them on your dashboards, personal or shared to have all the information you need at your fingertips, without needing to navigate between different pages. A wide variety of widgets allows you to choose the format that you like best to easily access your data.


