Finding Software Version Drift
Contents
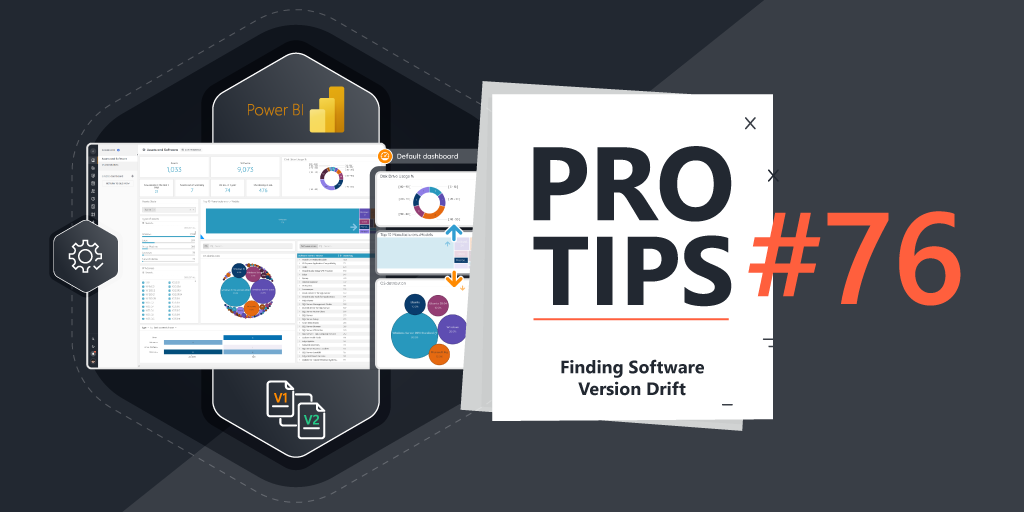
Pro Tips #76
Hello Sweepers! For this special end-of-the-year Pro-Tip, I will treat you to a totally true Holiday story that tells the time-old tale of how Lansweeper helped me tackle a growing problem in my IT environment. Indeed, it could also have quite possibly saved Christmas for everyone involved. Yes, It may be boring, and yes, I may have delayed Esben in getting this article out to the world, but hey – it’s a classic tale that you can pass on to your fellow sweepers, and… it wasn’t written by AI!
Back in the good ol’ days, as a systems administrator, all I really thought I needed to be concerned with as far as software compliance went, was if a necessary software was installed or not, if something installed was licensed or not, and if something was installed that shouldn’t be. As always, I had Lansweeper at my side – reporting on everything, deploying or uninstalling things as needed – and keeping everything compliant – it was a great feeling knowing that everything was in order. We had our quarterly security vulnerability scans from the Security team, and I would work the action items from the results – patching, upgrading, or mitigating potential threats that the scanner detected. Once the list was completed, that great feeling from having everything in order returned.
Then Lansweeper released ‘Vulnerability and Risk Insights’ – all of those “CVE’s” as I called them – were about to be right at my fingertips, whenever I needed them – soon I could see everything that I needed to fix, before the security team even had to say anything. Perfect!
Like Ralphie unwrapping his red-rider BB gun at Christmas in ‘A Christmas Story,’ I excitedly linked up my on-premise installation to the cloud by pasting in the linking code, and waited about 20 minutes for things to synch up – EASY! After looking to my left, then to my right, I said my favorite line of the movie – “All right Black Bart, now you get YOURS…’ and clicked that insights menu button… only to find…
Hundreds of active vulnerabilities.
Oh no! It can’t be! Page after page, sifting and sorting – I quickly realized that I wasn’t in a movie anymore. Exasperated, I slumped back defeatedly in my chair – and CRUNCH –
I had sat on my computer glasses. Oh no!
“Everything OK, Jacob?” my boss said – who appeared out of nowhere.
Resisting the urge to cry, I quickly picked up my broken computer glasses and composed myself. “Sure is, sir!” I replied. I sat down and made a plan of attack – and attack I did – only to find out that I wasn’t really making a dent. There had to be a better way!
Software Version Drift and Vulnerabilities
Sorting by Publisher… and then by Software Name, I realized a common theme – upgrading to the latest version of something was usually a common solution for getting rid of vulnerabilities. They call it ‘Software Sprawl’ when software gets out of hand in an IT environment – but in this case, it became clear to me that I had a problem within a problem: software *version sprawl.
I immediately thought: “There goes my Christmas – I’m going to have to watch ‘A Christmas Story’ from my laptop as I get a hold of this mess”
It’s crazy how, over time, applications quietly start packing in the ability to auto-update themselves. Before I knew it, my environment was riddled with rogue programs auto-updating (or failing to, or being blocked from…) and runaway software version drift was filling my risk insights list with tons of vulnerabilities – making a single application go from 2 critical vulnerabilities to over 30 – because I have older versions refusing to go away.
| Enemy Name | Software Name | CVE’s (Last 12 Months) |
| Black Bart | Google Chrome | 300 – 500 |

Visualize Drift With BI Dashboards
The second thought I had was – “How could I have missed this?” True, I had reports. True, I had the ‘alert dashboards’ widgets… but this problem fell through the cracks! Then it suddenly hit me – I had taken the new courses from The Lansweeper Customer Academy This is a perfect case for the new BI Dashboards!
“What’s a perfect case for what?” my boss replied. It seemed that I had said that last thought out loud.
With BI Dashboards, I quickly built a custom dashboard to make sure this wouldn’t happen again. I knew what I had to do.
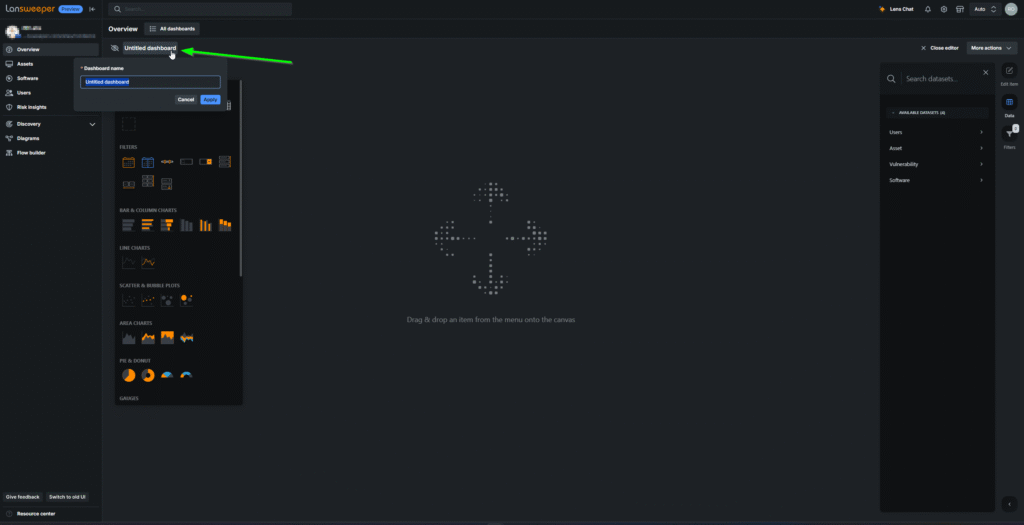
The first thing – I switched to the preview of the new UI. That’s a no-brainer.

Then – I clicked on ‘Create Dashboard’ at the upper right:

I clicked the name of the dashboard ‘Untitled dashboard’ and quickly renamed it ‘Software Version Sprawl:
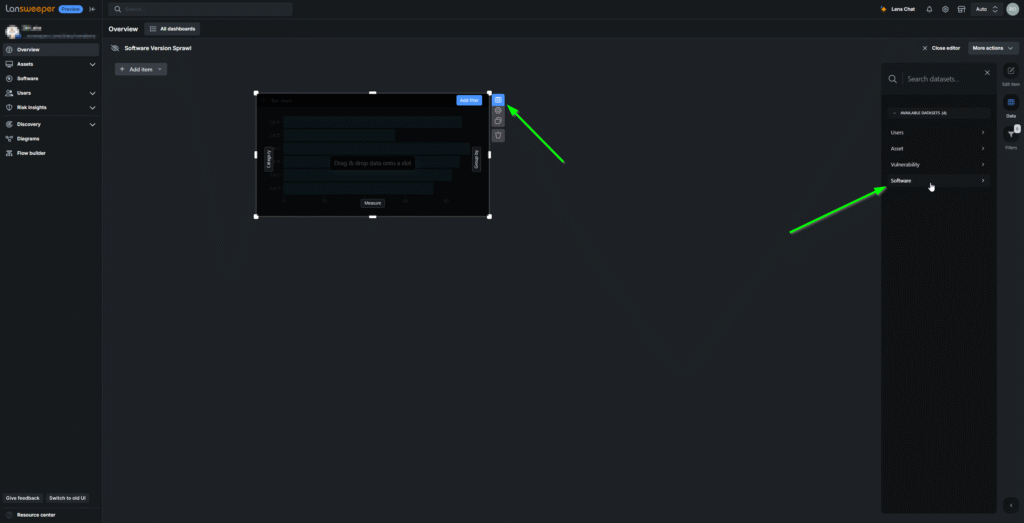
I was immediately confronted with a glowing ‘ + Add Item ‘ button, so I clicked it and chose a bar chart, and dragged it over to the canvas and positioned it to the top left:

It then prompted me to Drag & Drop the data onto the graph – I knew what I wanted – a count of the top 20 titles of software with the most versions – so I clicked ‘Software’ for the dataset, and dragged ‘Software Name’ and dropped it on the Y Axis:


In an instant – the bar chart sprang to life and populated the chart with the software name. “This is too easy! Too easy!!’“ I shouted maniacally. It was at this point, I saw that my holiday break might be saved!
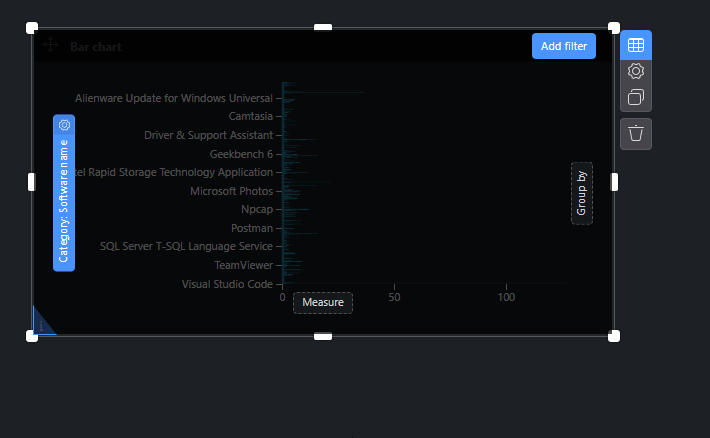
I wanted the number of versions – so I dragged ‘Version’ over to the X axis:

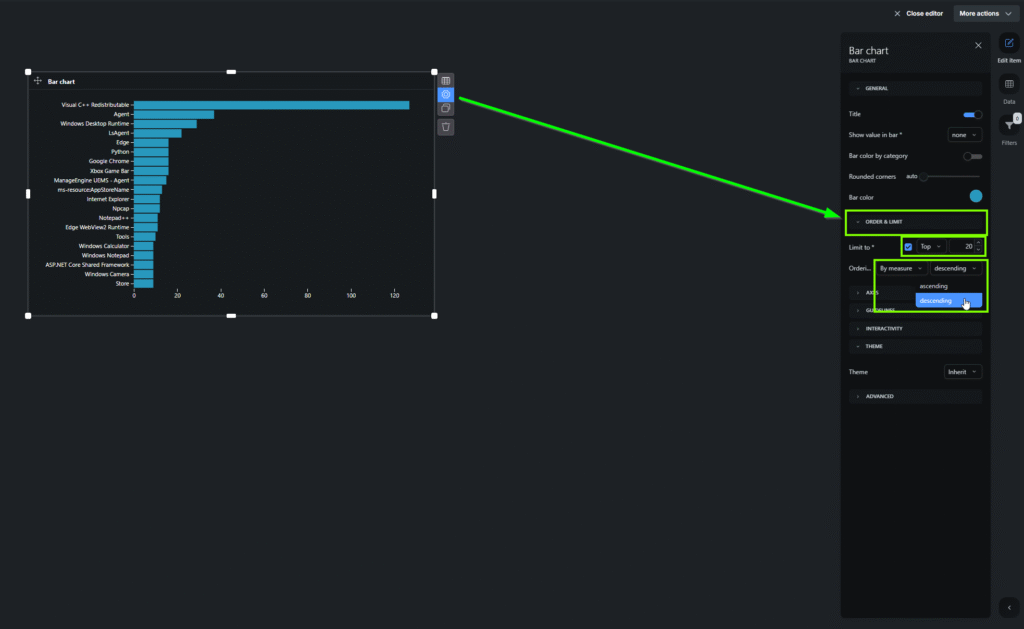
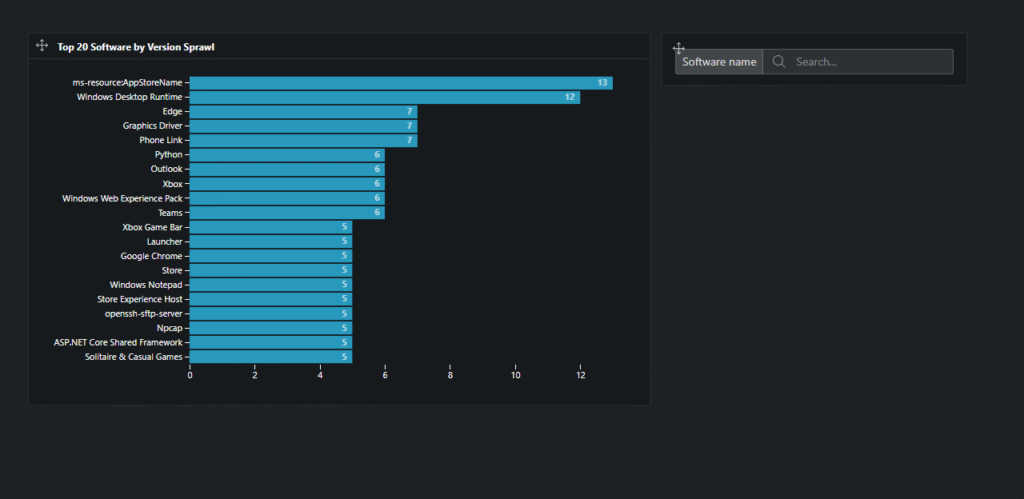
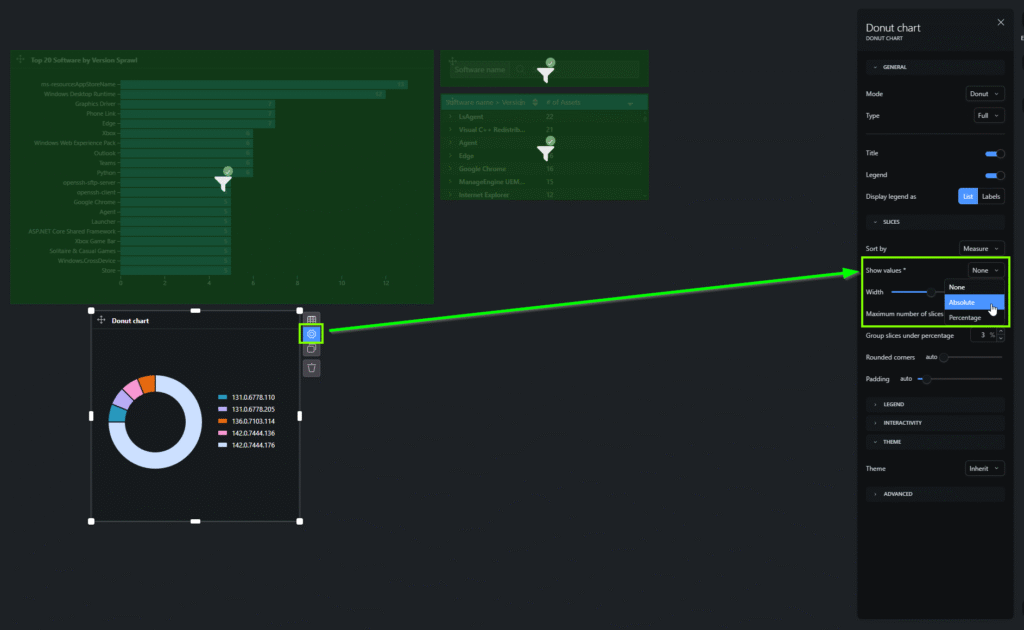
I then clicked the settings/gear icon, and want to ‘Order & Limit > Ordering > By Measure > Descending‘ to make the bar chart go from most to least and set the limit to the top 20:

‘Visual Studio C++ stuff is always going to have a bunch of different versions no matter what’ I contemplated – I clicked the ‘Data Table’ icon and added a filter ‘Software Name does not start with ‘Visual C++ Redistributable’

‘Hmm. I want numbers on my bars,’ I thought – so I clicked the gear icon, and found ‘Show Value in Bar’ and chose ‘Absolute’ to give me actual numbers, versus percentages.


‘Much Better!’ I decided. Now, I just clicked in the title and renamed it:

And set the version measure to be a distinct count, because I have assets with multiple versions of the same software – I didn’t want that scenario to increase the numbers.

And then the bar chart was complete. ‘Ah… I must have left the default Windows 11 junk like the Xbox overlay and games on my default deployment setup! … I’d better fix that’ I thought as I then moved on to the next chart.

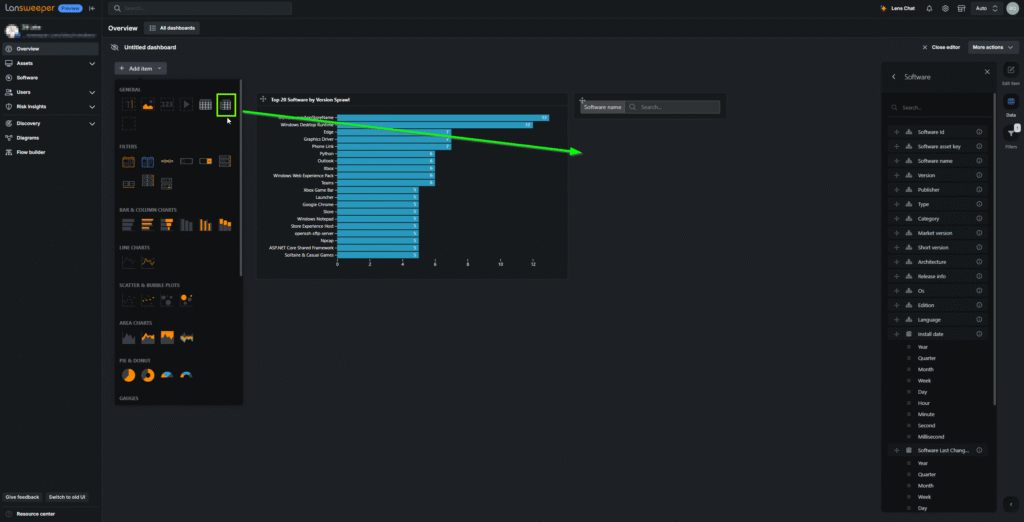
This was great – but I wanted to search for a software title should I be curious to know a single piece of software. No problem, I just went to ‘+ Add Item’ and chose a search filter, and dragged it on over – and chose ‘Software name’ to use for the search:


And just like that, it was there.
Next, I moved on to the neat pivot table that I saw on the main overview dashboard – I knew that would come in handy – so I dragged over the ‘pivot table’ object over to my dashboard and then dragged two things over to the ‘Rows’ section: Software Name, and Version, and then threw the Asset > Asset Key into the middle ‘Measures’ section.
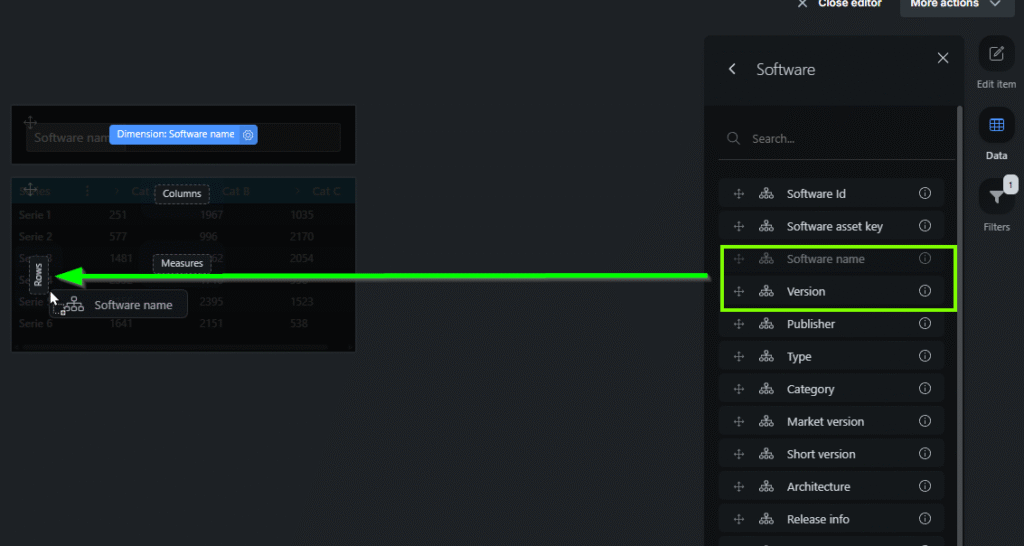


Again, I knew I needed to have it count distinct records because I had assets with multiple versions of the same software, and I also wanted to rename the column – so I clicked on the measure, and changed the aggregation and typed in a new name.

Could I make it clickable and update other things on the dashboard? I knew the gear icon would show me all the options – and I found it – ‘Filter on Select’

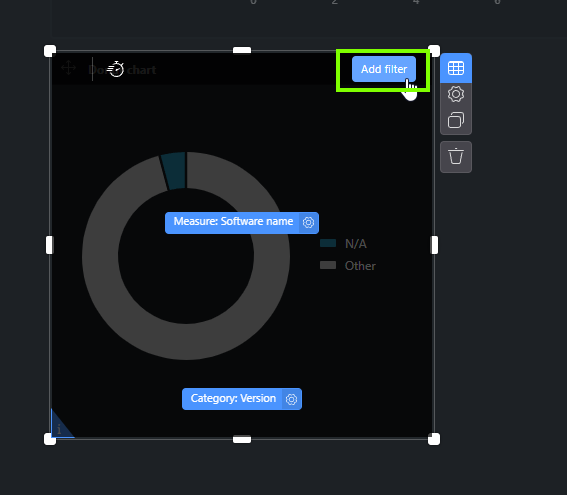
With the pivot table done, it was time to move on to shining light on my nemesis – Google Chrome. Though I could have picked a variety of other charts to drag over, I knew my favorite chart. Yes, the Donut Chart! I dragged it on over and threw ‘Software Name’ in the measure and ‘Version’ in the category section.


I just wanted Chrome. ‘You, Chrome. Yes You.’ I muttered as I clicked ‘Add Filter’ and made my rule ‘Software name Contains google chrome’ and displayed the absolute numbers in my donut slices.

I was almost done – all that was left, was to click the name of the chart and type in what I wanted to name it:

And there it was – staring me right in the face. ‘I can’t miss you now!’ I thought. Other donut charts were easy to make now – all I had to do was duplicate that one and change the software name to show:


After I made a few more, I wanted to see the actual assets – so I selected ‘table’ from the items and dragged it over:

Tables were even easier – I dragged over what I wanted to see and dropped it in: Asset > Asset Name, Software > Publisher, Software > Software Name, and Software > Version.


The only thing left, was to choose what I did and did not want being filtered when I clicked on the various items – so I clicked the gear icon on what I wanted, and then clicked the charts that I wanted to not change when I clicked through the pivot table:


I closed the editor, and took a look at what I had just created – a dashboard showing me at a single glance, my software version drift.
‘This is great. I’m going to rename it to ‘Jacob’s Software Version Drift’ and share it so that my boss can see it and maybe give me a holiday bonus…’ after all, it never hurt to try!

Combine with Flow Builder and Tame the Drift
‘OK Black Bart – I can see you clearly now. Guess what!? I have FLOW BUILDER and can integrate with Intune, Action1, Automox, PDQ… whatever endpoint management application that has an API! I will write another Pro-Tip for this! I will force you to update – oh yes – you will be compliant!’

“Uh – Jacob?” my boss said, clearly concerned. I had said that thought out loud too.
It didn’t matter. I had BI Dashboards to see everything. I had Flow Builder to integrate anything.
I knew that my holiday was saved!
“Sorry – yeah – I made a quick dashboard for us to see software version drift and will make a quick Flow Builder Flow automation to make sure our endpoint management app takes care of it”
I sat back in my chair, feeling better knowing that anyone on my team can now quickly see something that was hidden before – once again, using Lansweeper.
“Do you like the movie ‘A Christmas Story? We always watch it every year as a family” I proudly stated.
My boss smiled and nodded.
HAPPY HOLIDAYS!
-Jacob
Ready to get started?
You’ll be up and running in no time.
Explore all our features, free for 14 days.