The landscape of cyber threats is always evolving, demanding constant and quick adaptation from cybersecurity teams. Cybersecurity dashboards provide real-time visibility and insights into your network activity and anything that could be a threat to it. They empower security professionals to make quick and informed decisions, enhance incident response and detection, and safeguard the integrity of critical systems.
The Need for Real-Time Insights in Cybersecurity
Real-time insights play a pivotal role in cybersecurity and your organization’s cybersecurity strategy. In an ever-evolving threat landscape, immediate awareness is essential. Cyberattacks can happen at any time and can be immediately devastating, making real-time insights invaluable.
IT security dashboards offer a live overview of security events and incidents. They aggregate data from various sources and present it in an easily digestible format. This empowers security teams to quickly detect and respond to potential threats, reducing the window of vulnerability.
The sooner your security can identify and respond to threats, the better they can minimize the potential impact and prevent them from escalating. Using the comprehensive data found on an IT security dashboard, you can allocate resources effectively, prioritize vulnerabilities, and adapt security measures to address emerging threats.
Enhancing Threat Detection and Response
IT dashboards give you continuous access to real-time aggregated data from various security tools and systems. This constant vigilance allows security teams to stay ahead of emerging threats and vulnerabilities. The holistic view of your organization’s cybersecurity landscape enables security professionals to monitor network activity, system health, and potential vulnerabilities. Thanks to the broad perspective they can identify and address security gaps even before they become a problem.
Automated alerts and visualizations quickly highlight anomalies and potential threats, allowing security teams to respond proactively. This type of real-time threat detection helps organizations mitigate risks, reduce the impact of security incidents, and even prevent breaches from occurring altogether.
Visualizing Complex Security Data
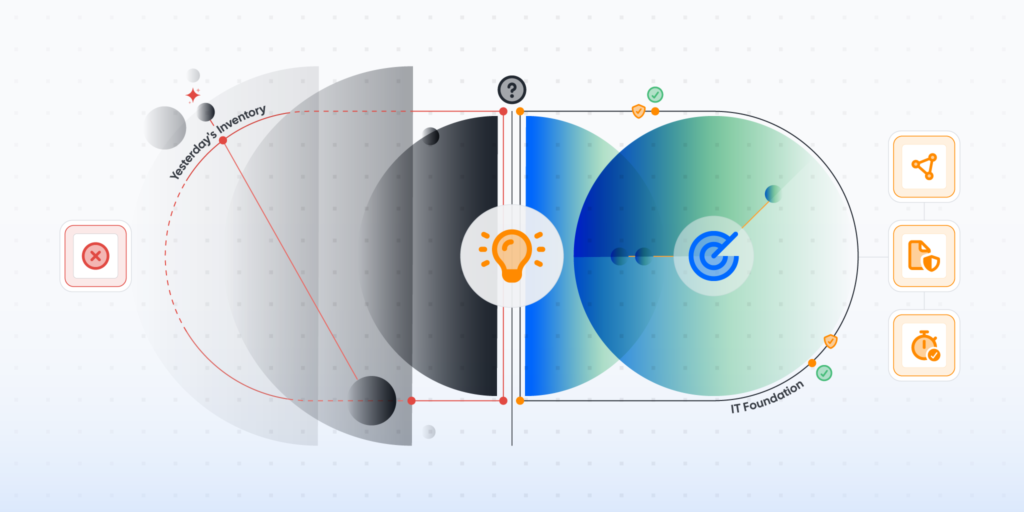
In an attempt to stay on top of all network activity, IT teams collect an avalanche of data. While this is helpful in making sure you don’t miss anything, it makes it challenging to discern meaningful insights from the noise. IT security dashboards provide a solution by translating complex data into clear, visually intuitive representations.
Network diagrams, for instance, visually map out an organization’s infrastructure, displaying interconnected systems, devices, and data flows. These diagrams help security professionals understand the network’s layout and identify potential vulnerabilities, bottlenecks, and dependencies.
Clear data representation simplifies the process of identifying anomalies, potential threats, and critical security issues. When security data is presented in a visually digestible format, it helps cybersecurity teams make informed decisions and prioritize and allocate resources accordingly.
Best Practices for Implementing IT Security Dashboards
There are a thousand different ways to build an IT security dashboard. The needs of every team, organization, and situation are unique. Here are some best practices to consider.

- Keep Your Audience and Purpose in Mind
When designing your dashboard, it’s important to keep in mind your target audience, their needs and priorities, and of course your security strategy. Who will be using this dashboard and what for? What problem are they looking to solve, and what questions are they trying to answer? What are their responsibilities and expectations? Is this dashboard for internal use, or is it used to report to stakeholders outside the team? - Selecting the Right Data
Once you have defined the audience and purpose of your dashboard you can start selecting the data and metrics to include. It can be tempting to just cram in as much information as possible, but that would defeat the purpose of the dashboard, namely clarity. Add only the data that is actually relevant to your purposes, that relates to each other and your security strategy, and that makes sense in the context. - Prioritize Usability
The main purpose of your IT security dashboard is to bring structure and clarity to massive amounts of data. Make sure that your dashboard is easy to understand and interact with. Use visuals like charts, graphs, and tables to structure your data in a meaningful way. Keep everything properly formatted and labeled so it is easy to navigate. When everything is properly set up, your users should be able to glean the most important insights at a glance. - Consider Adaptability and Scalability
Another important thing to keep in mind is that your dashboard needs to be able to adapt to changing goals and requirements. It also needs to be able to handle large quantities of data and, depending on its purpose, multiple users. Make sure that your dashboard has the flexibility to adapt to your organization’s changing needs. - Bring Dashboards into Your Way of Working
There is no point in building a beautiful dashboard if your users don’t go to work with it. Don’t let your dashboard just be a collection of pretty pictures to look at. Bring your team together and consider their needs when designing the dashboard. Make sure they know what it is for and how it will be implemented in your way of working moving forward.
IT Security Dashboards in Lansweeper
Lansweeper gathers tons of useful IT data for you. So it is only natural that it also provides a dashboard for you to neatly present it in an accessible way. Lansweeper’s IT dashboard lets you browse through selected relevant data in your own customized overview. The easy drag-and-drop widgets let you organize your key metrics in a way that matters to you.
- Centralize your IT security data in 1 dashboard.
- Customize your dashboard however you want.
- Use graphs, tables, and charts to visualize your data.
- Share your dashboard with your team.