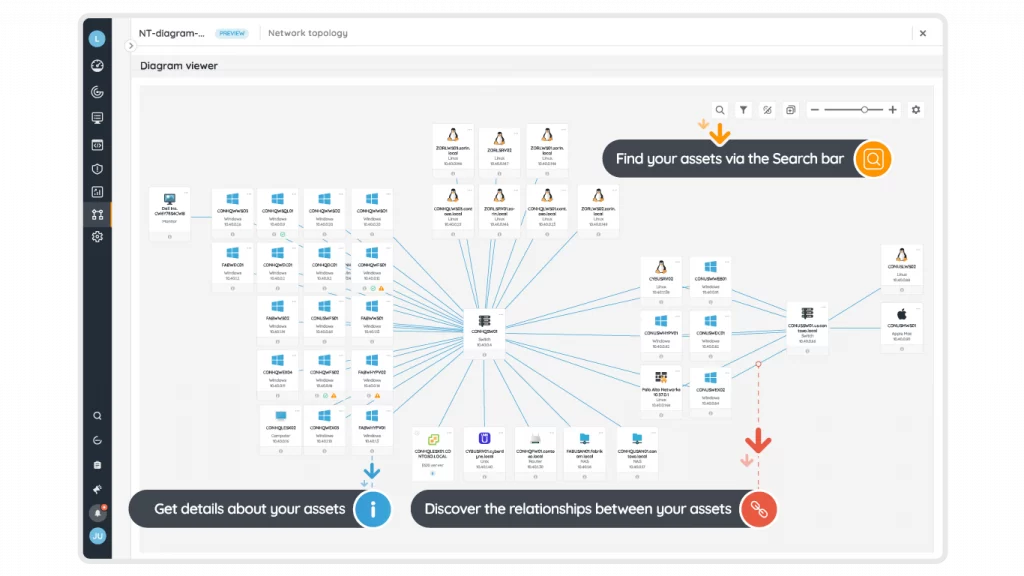
Extracting relevant insights from your IT inventory’s massive hoard of information can be challenging. The Diagrams feature offers a new visual way to analyze and understand your data. Discover at a glance the relationship between your assets with dynamically generated diagrams – for network topologies & virtual environments – on top of your inventory.
Generate network diagrams based on your IT inventory for instant insights.
Visualize Lansweeper’s wealth of IT asset data in different views to oversee your entire network at a glance.
Filter your diagrams by IP address, asset state, and asset type to quickly see the data you need.
See assets in context thanks to relationships and logical groupings such as locations, virtual machines, and common properties.
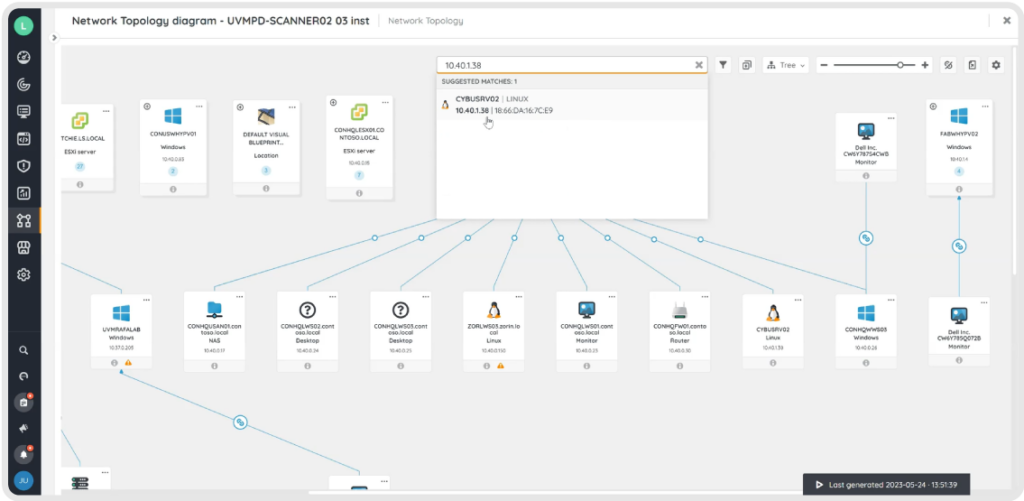
Search for assets in your diagram based on their name, IP address, MAC address, and asset type.
Export your diagrams and use them to support your decision making and future planning.
Thanks to the clear visual representation of your network, network topology Diagrams help you quickly understand your IT estate and the relationships between your IT assets. An easy-to-read network map is a helpful tool in various IT scenarios and projects. It is valuable for troubleshooting network problems, maintenance, configuration management, performance management, coordinating updates, and creating network documentation.
A visual overview will help you gain a better understanding of your IT environment, but it still has a lot of information to comb through. The view selector lets you change the diagram layout to a star or tree format to best suit your needs.
Search for specific assets using the search bar, to quickly see how a device fits into your network. You can search by name, IP address, MAC address, or asset type. Still, too much stuff you don’t need? Filter your diagram by asset type, IP address, or asset state to show what’s relevant to you right now.
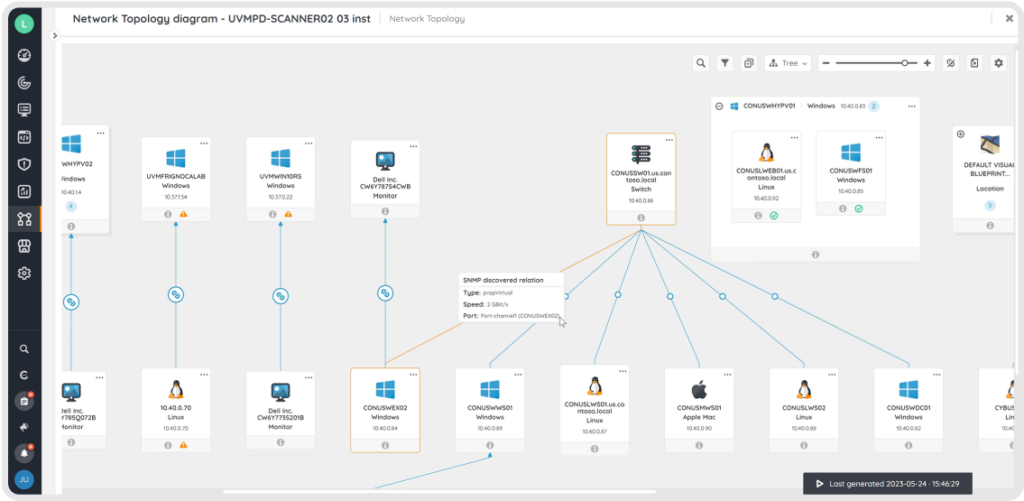
Use your newly obtained insights into your IT environment to find out where your misconfigurations lie. Make sure your assets are connected in the way you envisioned. The visual representation makes it easy to spot ghost assets, see areas of the network that are misconfigured, and understand how issues affecting a single device can impact the rest of your IT estate.
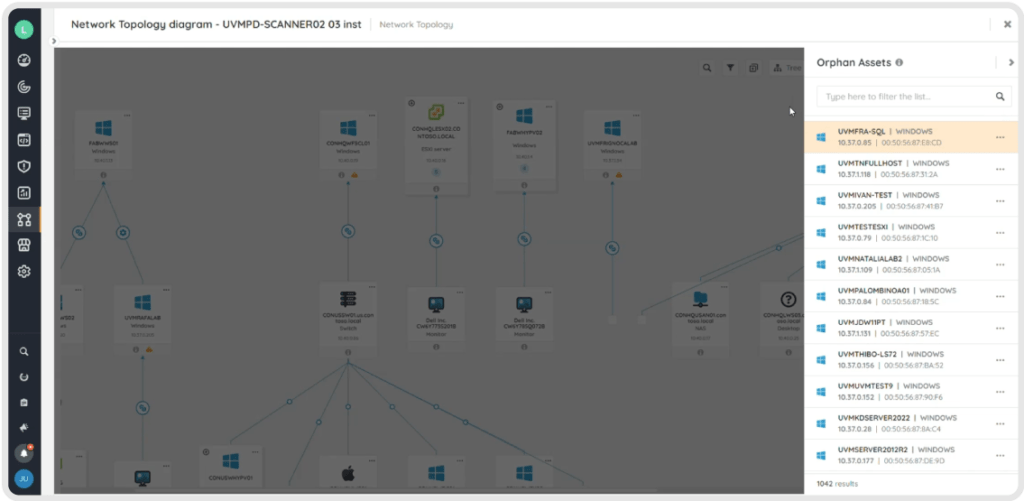
Discover isolated assets in the Orphan list and create the correct asset relationships on the dependency map leaving no asset behind. Any changes you make to the diagram will automatically be displayed on your asset pages to keep your inventory up to date. Refresh your diagrams on the fly by generating updated versions matching the content in your Inventory.
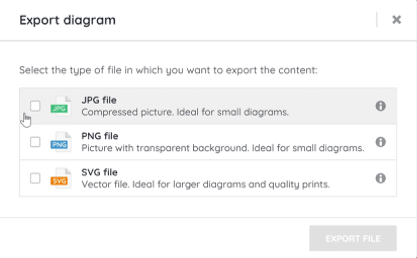
Once you have your diagrams in place, export them to share with colleagues, stakeholders, and clients to inform decision-making. Include your diagrams in reports, proposals, presentations, and training materials to provide a clear overview of the current state of your IT environments and any planned changes. Keep your diagrams on hand to prepare for audits and compliance reports.
Explore all our features, free for 14 days.