As every IT professional knows, IT environments are getting larger and more complex as time goes on. Every day, the task of keeping track of the full scope and configuration of the technology estate demands more effort and attention. With IT professionals everywhere wanting to take control of the IT sprawl, network diagramming tools are on the rise. What can they do for you?
Understanding the Benefits of Diagramming Tools
A clear visual representation of your network topology has many applications for anyone whose involved with your IT. It lets you understand your IT estate and the relationships between your IT assets in a quick and accessible way. It can help with everything from troubleshooting network problems, maintenance, configuration management, performance management, and coordinating updates, to creating network documentation.
Most network management tools like Lansweeper can give you a list of all assets in your IT estate. They provide detailed information on an asset’s individual configuration and properties. By adding diagramming capabilities, you can see at a glance how these individual assets relate to each other in the broader configuration of your network.
Key Features and Functionalities of Diagramming Tools
Network diagrams all have a very simple premise. They are a visual representation of the IT assets in your network and the connection between them. Because it is a visual overview they can give more information at a glance than a listed inventory.
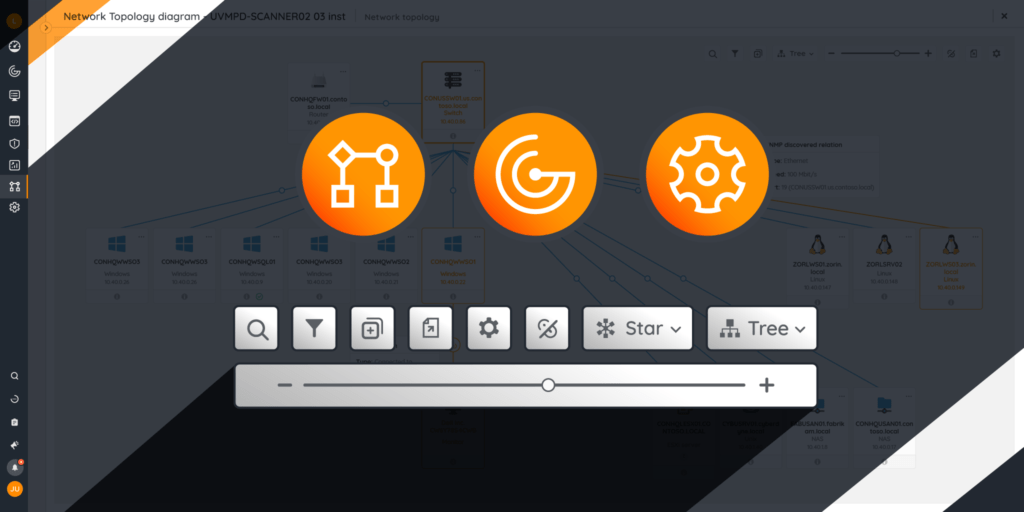
Network diagrams like those in Lansweeper often let you choose the way you want to view your network topologies. The purpose of a network diagram is to make it easier to grasp the network configuration. The larger and more complex your network gets, the messier your network visualization can get. As such, customization is an important part of any diagramming tool.
Customization options almost always include different diagram layouts and filters. If a diagram feels overcrowded you can use them to select what information you want to see. Diagrams are usually also searchable. That way you can easily locate a specific asset in large diagrams and see how it fits into your network configuration.
Simplifying Troubleshooting with Diagramming Tools
Troubleshooting is the place where you can really put your diagrams to good use. When responding to incidents and outages, a lot of time and effort goes into the initial stage of locating an issue and determining its impact. After that, you can move on to figuring out how to fix the issue without breaking anything else.
A visual representation of your network topology allows you to quickly locate where and how an issue is situated within your network. It lets you trace back from where you first saw the effects of the issue to where it originates from. It also lets you track more easily what other devices are or could be impacted. It also helps you determine exactly how you can isolate the incident and affected devices.
From a more proactive point of view, diagrams allow you to set up your network in a way that lets you isolate asset groups more easily. You can limit the impact of an incident by carefully planning how assets and asset groups are connected to the rest of the network. When you can see all the different connections and dependencies, it is easier to set them up in a way that they can be cut off quickly when an asset is under attack.
Optimizing Network Performance with Diagramming Tools
Network diagrams don’t just show you the topology of your network. It gives you insight into the full scope and by extension the resources you have at your disposal. If you don’t know what assets you have, you can’t be using them as efficiently as possible. Map out your network to find out which assets you have and what their capacity is to avoid bottlenecks and optimize your network configuration.
This is especially true for virtual environments. These can be even harder to keep track of because there are no physical machines to keep an eye on. However, virtual resources are still an investment so you want to use them efficiently. Mapping out your virtual environments makes it easier to keep track of your virtual assets, their used resources, and running status.
Lansweeper Diagrams
Lansweeper’s Diagrams feature lets you visualize the massive hoard of IT asset data that Lansweeper collects for you. Dynamically generated diagrams give you insight into your network topology and virtual environments at a glance. With these new insights, you can make sure your assets are connected and configured in the way you envisioned.
· Visualize your IT estate within minutes, no matter how complex.
· Gain useful insights at a glance.
· Simplify your troubleshooting.
· Take control of your network configuration.
Are you ready to get started visualizing your IT estate? Try Lansweeper’s Diagrams now.