Combine complete and accurate IT asset data with data from other sources for holistic analysis.
Easily create data representations, dashboards and reports, and share them with stakeholders.
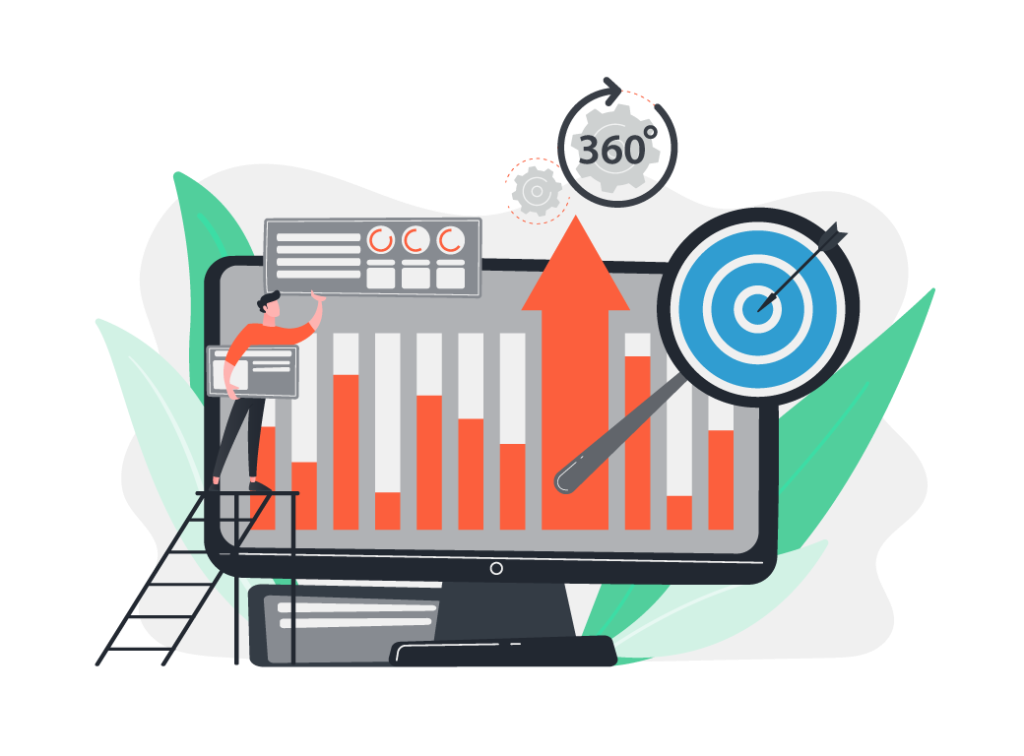
Get insights and analyze trends
at-a-glance to drive decision-making.

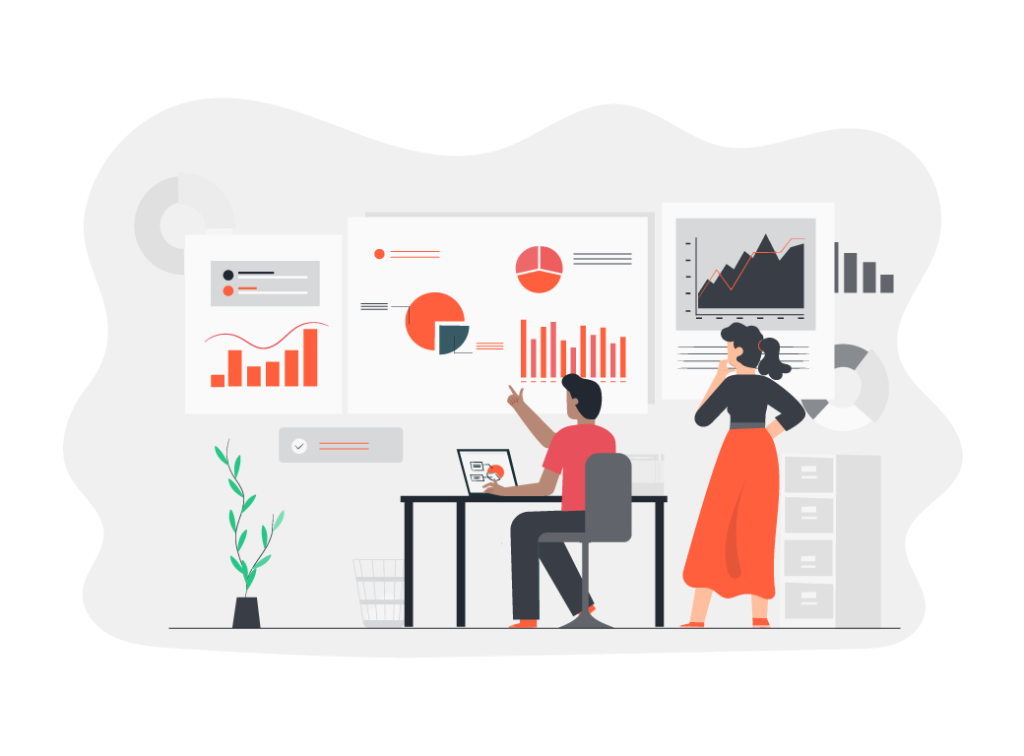
In recent years, the use of Data Analytics and Business Intelligence (BI) has increased among organizations as they look to leverage the vast amounts of data available to improve decision-making. Analytics help to reveal trends and surface useful metrics that would otherwise be lost in an endless sea of data points. With tools and techniques to analyze and make sense of this data, businesses can extract invaluable insights and use them to increase overall efficiencies, optimize operations, improve productivity and better serve their customers.
Lansweeper users can now take analytics to the next level by blending Lansweeper data with data from other sources across the organization using BI/Analytics tools such as Microsoft Power BI. For example, analyzing IT asset data alongside payroll data helps to verify hardware availability and helps plan for additional resources as new employees are brought on board. When combined with financial data, it helps to verify budget requests for equipment renovations and purchases. Analyzing data from Lansweeper and various other sources holistically enables teams to find answers to business questions that require multiple inputs from multiple business units.

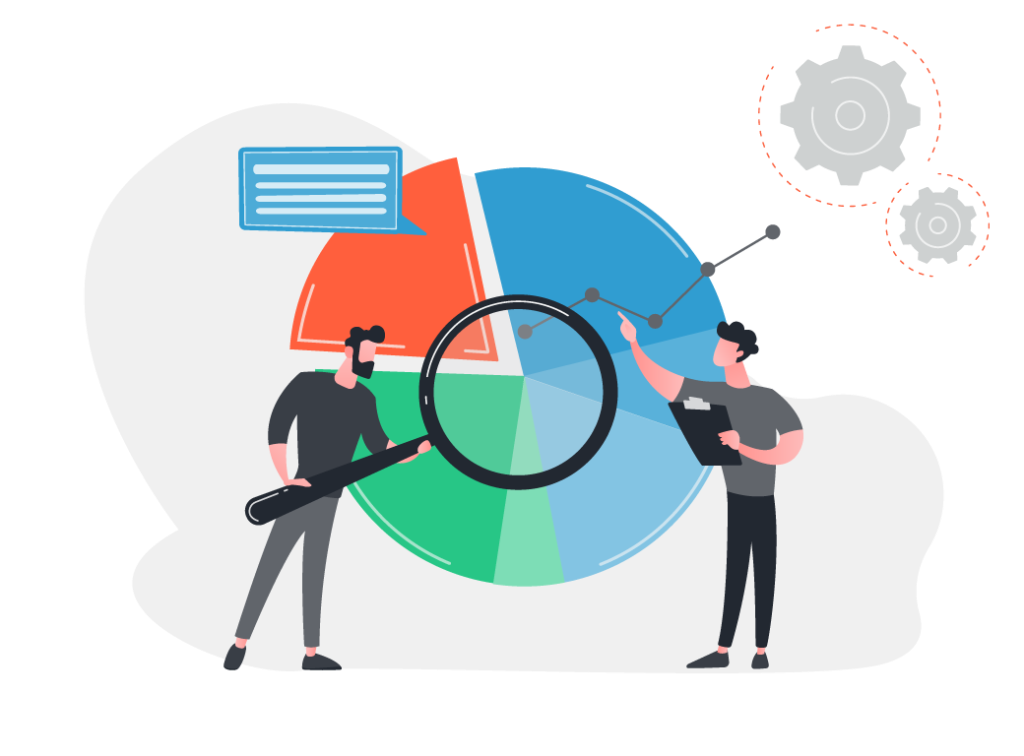
Lansweeper provides more than 450 built-in reports, dashboards, and widgets to help you understand, analyze and visualize data quickly and easily. When used in conjunction with market-leading Analytics and BI tools, Lansweeper enables you to fetch IT asset information from the Lansweeper platform and visualize it with the help of your analytics tool’s data representations. Data from various sources can be used to enrich the Lansweeper data model with additional fields, categories, and groups that are relevant to specific business use cases and functions.
The ability to create a 360-degree view of all of your data enables you to showcase the IT value chain and provide insights that help optimize investments and allocate resources to maximize ROI.
With complete visibility across the IT value chain, CIOs can make more informed business decisions. Lansweeper data is always accurate and up to date, so it provides a frame of reference for analyzing trends over time.
Lansweeper integrates seamlessly with popular BI/Analytics tools such as Microsoft Power BI, reducing deployment times and minimizing the need for customization. The integration enables you to leverage Lansweeper’s comprehensive, accurate IT asset data alongside other business data for a 360° view. We provide two dashboard templates for Power BI: one for Power BI Cloud and one for Power BI desktop. Please refer to the user guide and templates available in our technical documentation, to learn how to export and visualize your data leveraging our API.
Explore all our features, free for 14 days.