
Pro Tips with Esben #25
The very first edition of Pro Tips covered Windows updates and getting more data on Windows update settings configured in your environment. This time we’re going to take a closer look at what updates have been installed, when and how long a device has been online for.
Windows updates are one of the most time-consuming things for many system administrators. Every month a new cycle starts with the release of all the information, testing, deploying, reverting what got broken, testing again when they finally fix it, and so on. Some months by the time you’re finally done a new patch Tuesday is just around the corner.
Getting a better overview of the update status is really only the basics then, and while the Patch Tuesday reports do give you an overview, it doesn’t always give you all the context you need. With the following reports, you’ll get a little bit closer to perfecting your Patch Tuesday dashboard in Lansweeper.
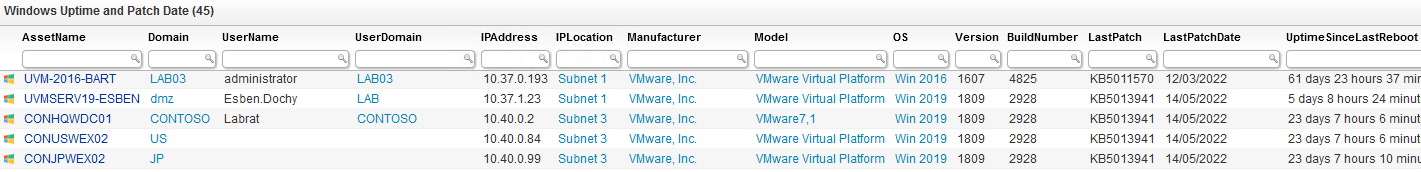
Latest Patch Installed & Uptime Overview
The first report is more of an overview if you want a nice list to scroll through with some extra asset details. Whether you want to check what the highest KB patch installed on an asset is or how long it has been since the last reboot, you’ll be able to easily filter the report.
Patch, Build, and Uptime Charts
The easiest way to get a better sense of the current status is with charts. If you’ve been following the series, you’ll know I’ve been posting these more and more since the default chart options are rather limited and I’m a big fan of creating dashboards that give you an easy-to-understand metric to monitor.
For the Windows Update dashboard, I’ve created three new chart reports.
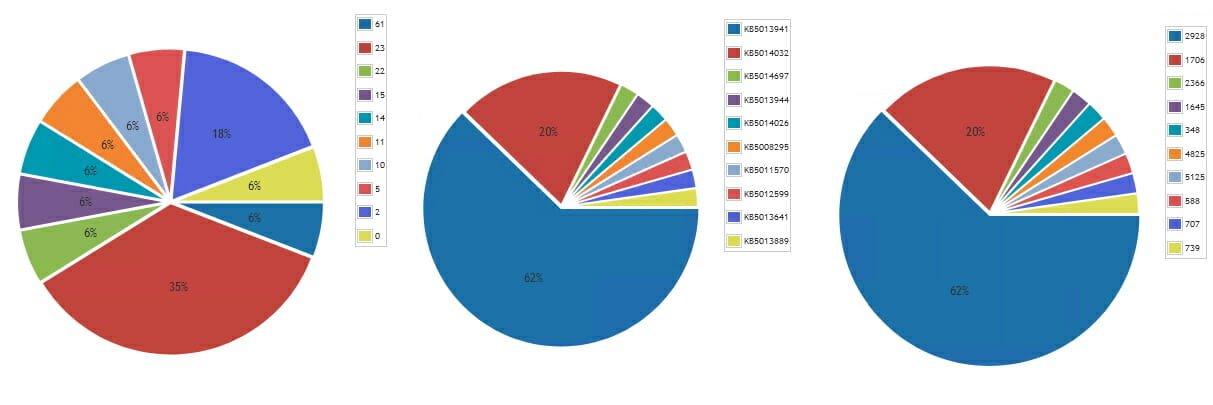
A chart showing the highest patch number installed on a device. Want to know if you’ve got any assets that have a problematic patch installed? This is an easy way to know if you’ve got devices affected by Microsoft’s QA work.
A chart showing the Windows 10 build spread in your environment. Build can be seen as an alternative to reporting on specific patches. Each patch in theory updates the build number, so this will help you quickly see how many of your Windows 10 devices are on the latest build.
The last chart is for uptime. After a Windows update, an asset must be rebooted before the update is applied, long uptimes can be an indication that you’ve got devices that are not being updated. Additionally, you can get more specific by scanning the pending reboot status of a device as detailed in the first Pro Tips blog.