When you identify server performance degradation, the usual suspects are CPU, memory, and the disk. The CPU is the processing power of your computer. When usage is high, a normally fast computer can slow to unbearable speeds. For some computers, this may be a memory problem, but some people experience high CPU usage from programs that utilize most of the available resources.
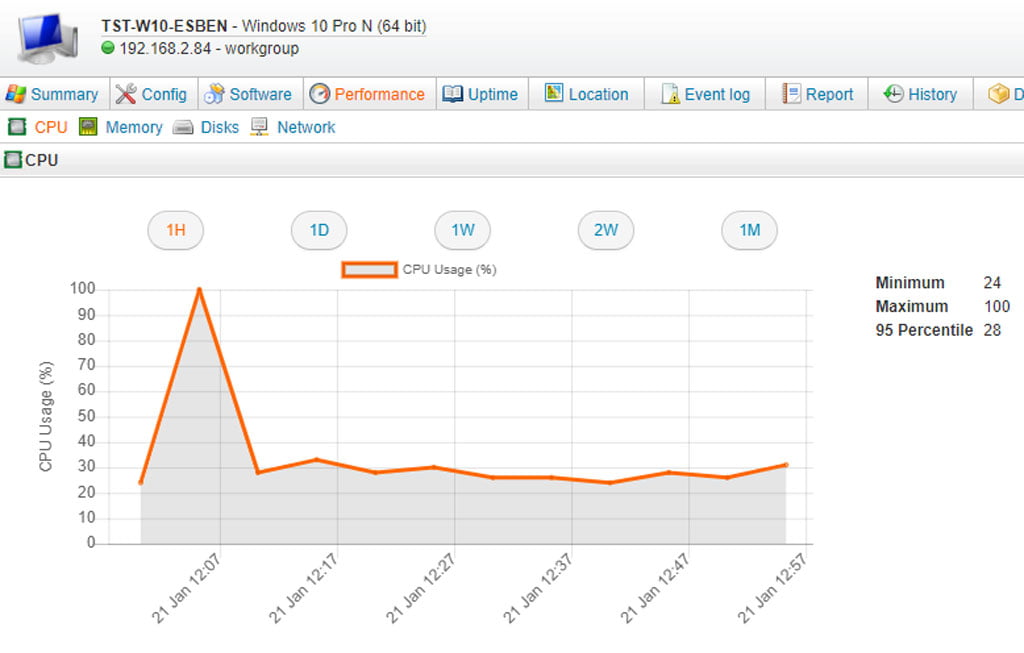
Regular monitoring of both your CPU load in single moments and graphs over days, weeks and months will give you an accurate overview of your system’s capabilities. Since Lansweeper 7.1, Lansweeper’s Performance Counter monitoring allows administrators to quickly diagnose the CPU utilization of their Windows assets, without the need for installing an agent first.
This provides an added layer of insight into the day-to-day operations of your IT infrastructure. With the added benefit of resources usage metrics, managing the efficiency of your IT becomes that much easier. Learn how to scan Windows Performance Counters in this knowledgebase article.
Track Assets with High CPU Usage
If you have a Lansweeper 7.1 installation, we’ve created a custom CPU report which allows you to spot high resource utilization in no time. The report lists your top 5 Windows hosts who’ve been eating most of their CPU. If you want to list more than 5, you can easily adapt the report according to your needs.
If you haven’t already, download a free trial of Lansweeper to run the report and find your top 5 of CPU consuming assets.
The Report:
Select Top 5 tblAssets.AssetID,
tblAssets.AssetName,
Cast(Avg(tblPerformanceCountersScanMetric.Value) As int) As [Average CPU usage in %],
Coalesce(tsysOS.Image, tsysAssetTypes.AssetTypeIcon10) As icon,
Max(tblPerformanceCountersScan.ScanDateTime) As [Last scan]
From tblAssets
Inner Join tblAssetCustom On tblAssets.AssetID = tblAssetCustom.AssetID
Inner Join tsysAssetTypes On tsysAssetTypes.AssetType = tblAssets.Assettype
Inner Join tblPerformanceCountersScan On tblAssets.AssetID =
tblPerformanceCountersScan.AssetId
Inner Join tblPerformanceCountersScanMetric On tblPerformanceCountersScan.Id =
tblPerformanceCountersScanMetric.PerformanceCountersScanId
Left Join tblPerformanceCountersScanMetricIdentifier On
tblPerformanceCountersScanMetricIdentifier.Id =
tblPerformanceCountersScanMetric.PerformanceCountersScanMetricIdentifierId
Inner Join tsysPerformanceCounterMetric On tsysPerformanceCounterMetric.Id =
tblPerformanceCountersScanMetric.Metric
Left Join tsysOS On tsysOS.OScode = tblAssets.OScode
Where tsysPerformanceCounterMetric.[Group] = ‘CPU’ And tblAssetCustom.State = 1
Group By tblAssets.AssetID,
tblAssets.AssetName,
Coalesce(tsysOS.Image, tsysAssetTypes.AssetTypeIcon10)
Having Max(tblPerformanceCountersScan.ScanDateTime) > GetDate() – 7
Order By [Average CPU usage in %] Desc
How to Run this Report
- Verify that you meet the Performance Counter scanning requirements.
- Open the report builder in the Lansweeper web console under Reports/Create New Report.
- Paste the SQL query (report) below at the bottom of the page, replacing the default SQL query.
- Left-click somewhere in the upper section of the page so the query applies.
- Give the report a title.
- Hit the Save & Run button to save the report. Export options are listed on the left.
Get Your Hands on the Latest Network Reports for Free
"*" indicates required fields